Where would the money go? That was the lingering question after sales of PPE and health and safety products retreated in the waning days of the pandemic. There’s been a clear answer: apparel. Every apparel category (save caps and headwear) got a solid boost in 2022, as clients gravitated toward giveaways, gifts and uniforms. Otherwise, the top promo product categories (thankfully, refreshingly) held the status quo. In fact, nine of the top 10 categories are the same from last year. The one that didn’t survive? You might have guessed – PPE.
Hover over the bar charts to see more detailed State of the Industry statistics.
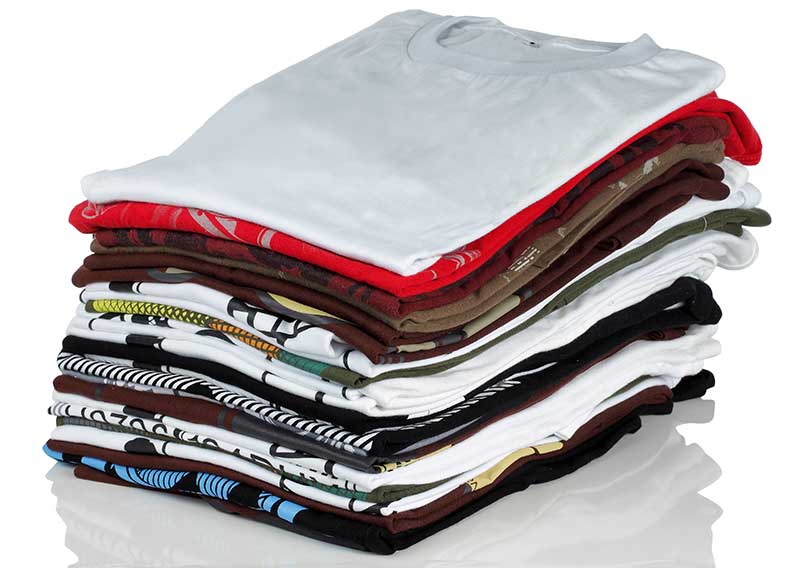
T-shirts command the highest percentage of industry spending since Counselor first started tracking the category in 2012.
TOP 10 PRODUCT CATEGORIES
(As Percentage of Overall Promo Products Sales)
And The Rest
- Health & Safety 3.3%
- Buttons/Badges/Ribbons/Stickers/Decals/Emblems/ Lanyards 2.9%
- Electronics/USBs/Computer-Related Products (Non-Mobile Tech) 2.6%
- Blankets/Towels 2.4%
- Recognition Awards/Trophies/Jewelry 2.2%
- Mobile Tech Accessories 2.2%
- Housewares/Tools 2.1%
- Calendars 2.0%
- Books/Cards/Postcards/Stationery/Giftwrap 2.0%
- Magnets 1.5%
- Food Gifts & Bottles of Water 1.2%
- Other 0.9%
4 Eye-Opening Product Trends
There are a few big winners in the post-pandemic product landscape, but also one obvious category that dropped precipitously.
T-SHIRTS
The percentage that drinkware’s market share has increased since 2008.

